Infographics are a fantastic tool for making an article stand out and engaging your readers effectively. They serve to break up textual content, making information more digestible and visually appealing. Here’s how infographics can enhance your articles:
1. Visual Appeal: Infographics are eye-catching, incorporating colors, images, and design elements that capture the reader’s attention. They make your article visually appealing, drawing readers in.
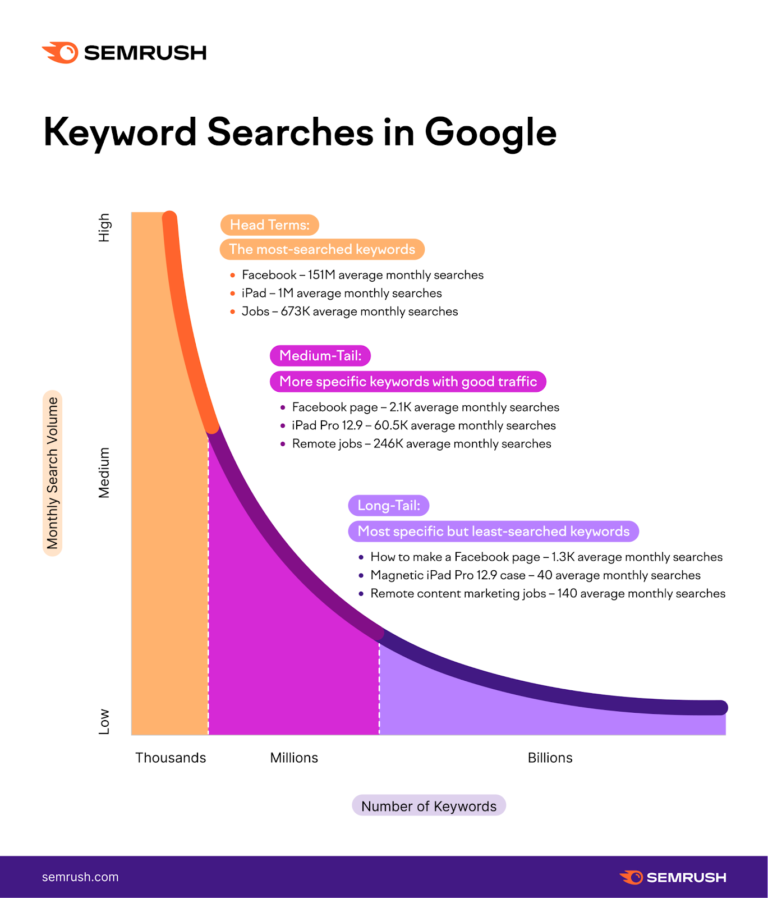
2. Simplifies Complex Data: Complex data, statistics, or processes can be simplified and explained in a clear, concise manner through infographics. This makes it easier for your audience to understand the key points.
3. Increased Retention: Visual content is more memorable than plain text. Readers are more likely to remember the information presented in an infographic, even long after they’ve read the article.
4. Scannability: In today’s fast-paced world, readers often skim articles. Infographics allow for easy scanning, with key points presented in a format that can be quickly absorbed.
5. Storytelling: Infographics can help you tell a story or convey a narrative within your article. They provide a logical flow, guiding readers through the content.
6. Emphasizes Key Information: Important data or statistics can be highlighted within an infographic, making it stand out and leaving a lasting impression.
7. Shareability: Infographics are highly shareable on social media platforms. Readers are more likely to share visually appealing content, increasing the reach of your article.
8. Branding: Infographics can be designed to align with your brand’s colors and style, reinforcing your brand’s identity.
9. Mobile-Friendly: With the increasing use of mobile devices, infographics are mobile-friendly and offer a better reading experience on smaller screens.
10. Enhanced SEO: Search engines also consider user engagement. If readers spend more time on your article because of engaging infographics, it can positively impact your SEO rankings.
Here’s a simple breakdown of how infographics help your article stand out:
Introduction:
- Begin by introducing the topic and the role of infographics in enhancing your article’s quality.
Benefits of Infographics:
- Explain the advantages of using infographics in articles.
Visual Appeal:
- Discuss how infographics make your content visually appealing.
Data Simplification:
- Highlight how they simplify complex data and processes.
Increased Retention:
- Emphasize the better retention of information with infographics.
Scannability:
- Explain how infographics cater to skimming readers.
Storytelling:
- Show how infographics can be used to convey narratives.
Emphasizing Key Information:
- Discuss how infographics make important data stand out.
Shareability:
- Describe the potential for infographics to go viral on social media.
Branding:
- Explain how you can use infographics to reinforce your brand identity.
Mobile-Friendly:
- Highlight the importance of infographics in a mobile-centric world.
Enhanced SEO:
- Mention how infographics can positively impact SEO.
Conclusion:
- Sum up the key points, reiterating how infographics are a powerful tool for making your articles stand out.
Incorporating infographics into your articles can undoubtedly help you achieve your goal of becoming the best digital marketing instructor and a successful online entrepreneur. It enhances the quality and engagement of your content, which is crucial in the digital realm. Good luck in your endeavors!