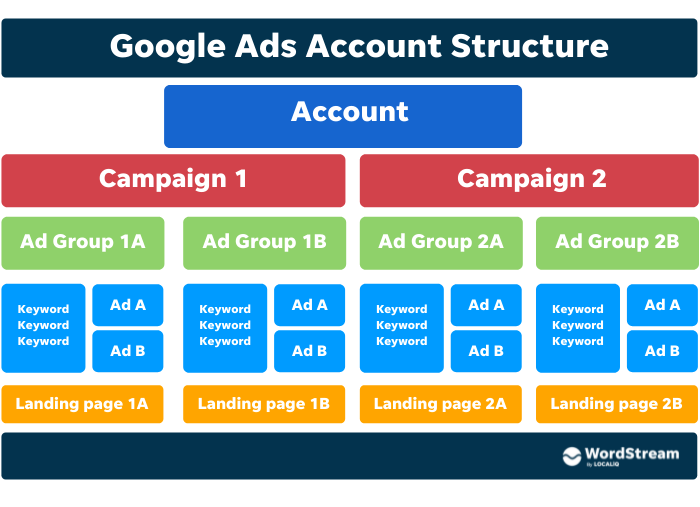
In today’s fast-paced world, bombarded by information, infographics have emerged as powerful tools for clear and concise communication. But within the realm of infographics, a specific element, the “infographic chart,” often takes center stage.
What exactly is an infographic chart?
An infographic chart is a visual representation of data within an infographic. It utilizes various chart types, like bar graphs, pie charts, line graphs, and flowcharts, to present information in a visually appealing and easily digestible format.
Why are infographic charts so effective?
Here’s why infographic charts hold such power:
- Enhanced Comprehension: Compared to text-heavy presentations, charts leverage our brain’s natural ability to process visual information more efficiently.
- Pattern Recognition: Charts effectively convey trends, patterns, and relationships between data points, making it easier to draw conclusions.
- Memorability: The visual appeal of charts and clear data representation increase information retention and recall.
- Engagement: Eye-catching visuals capture attention and draw viewers in, making complex data more engaging.
Types of Infographic Charts:
The choice of chart type depends on the nature of the data being presented. Here are some common types:
- Bar Graphs: Ideal for comparing categories or showing changes over time.
- Pie Charts: Effective for showcasing proportions or breakdowns of a whole.
- Line Graphs: Best suited for depicting trends and changes over a continuous period.
- Flowcharts: Used to illustrate steps in a process, sequence of events, or decision-making paths.
Beyond Aesthetics: Interpreting Infographic Charts:
While captivating visuals are crucial, understanding what the chart depicts is equally important. Here’s what to watch for:
- Chart Title: Clearly states the key message or data being represented.
- Labels: Identify the data points represented by each bar, slice, or line.
- Units: Specify the units of measurement used on the axes (e.g., percentage, dollars).
- Source: Indicates the origin of the data, promoting transparency and credibility.
In conclusion, infographic charts are powerful tools for presenting information in a clear, engaging, and memorable way. By understanding their purpose, types, and interpretation techniques, you can become a more informed and empowered consumer of information in today’s visually driven world.


